Chapter 5 cheat sheet
Chapter 5 cheat sheet: Frequency response analysis
Drive a stable system with a sine wave and, once the transient dies, the output is a sine at the same frequency, scaled and delayed. Bode and Nyquist plots record that scaling and delay at every frequency, and from them come the gain and phase margins: how far a loop is from instability.
Start here
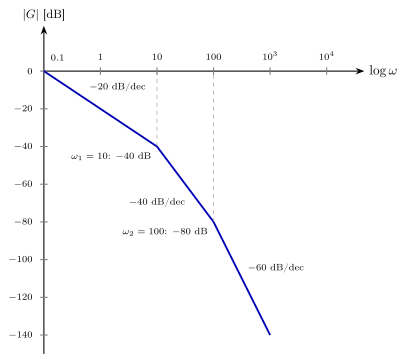
Write G(jω) in time-constant form, add each factor's straight-line asymptote in decibels, then read the margins at the two crossover frequencies.
One picture
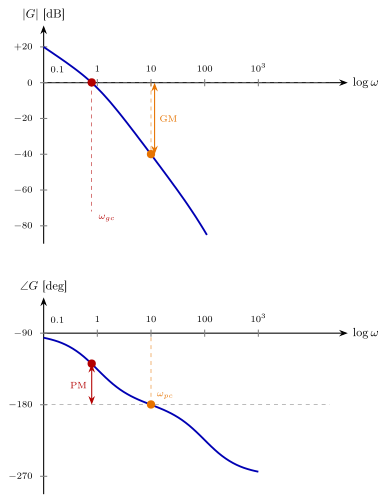
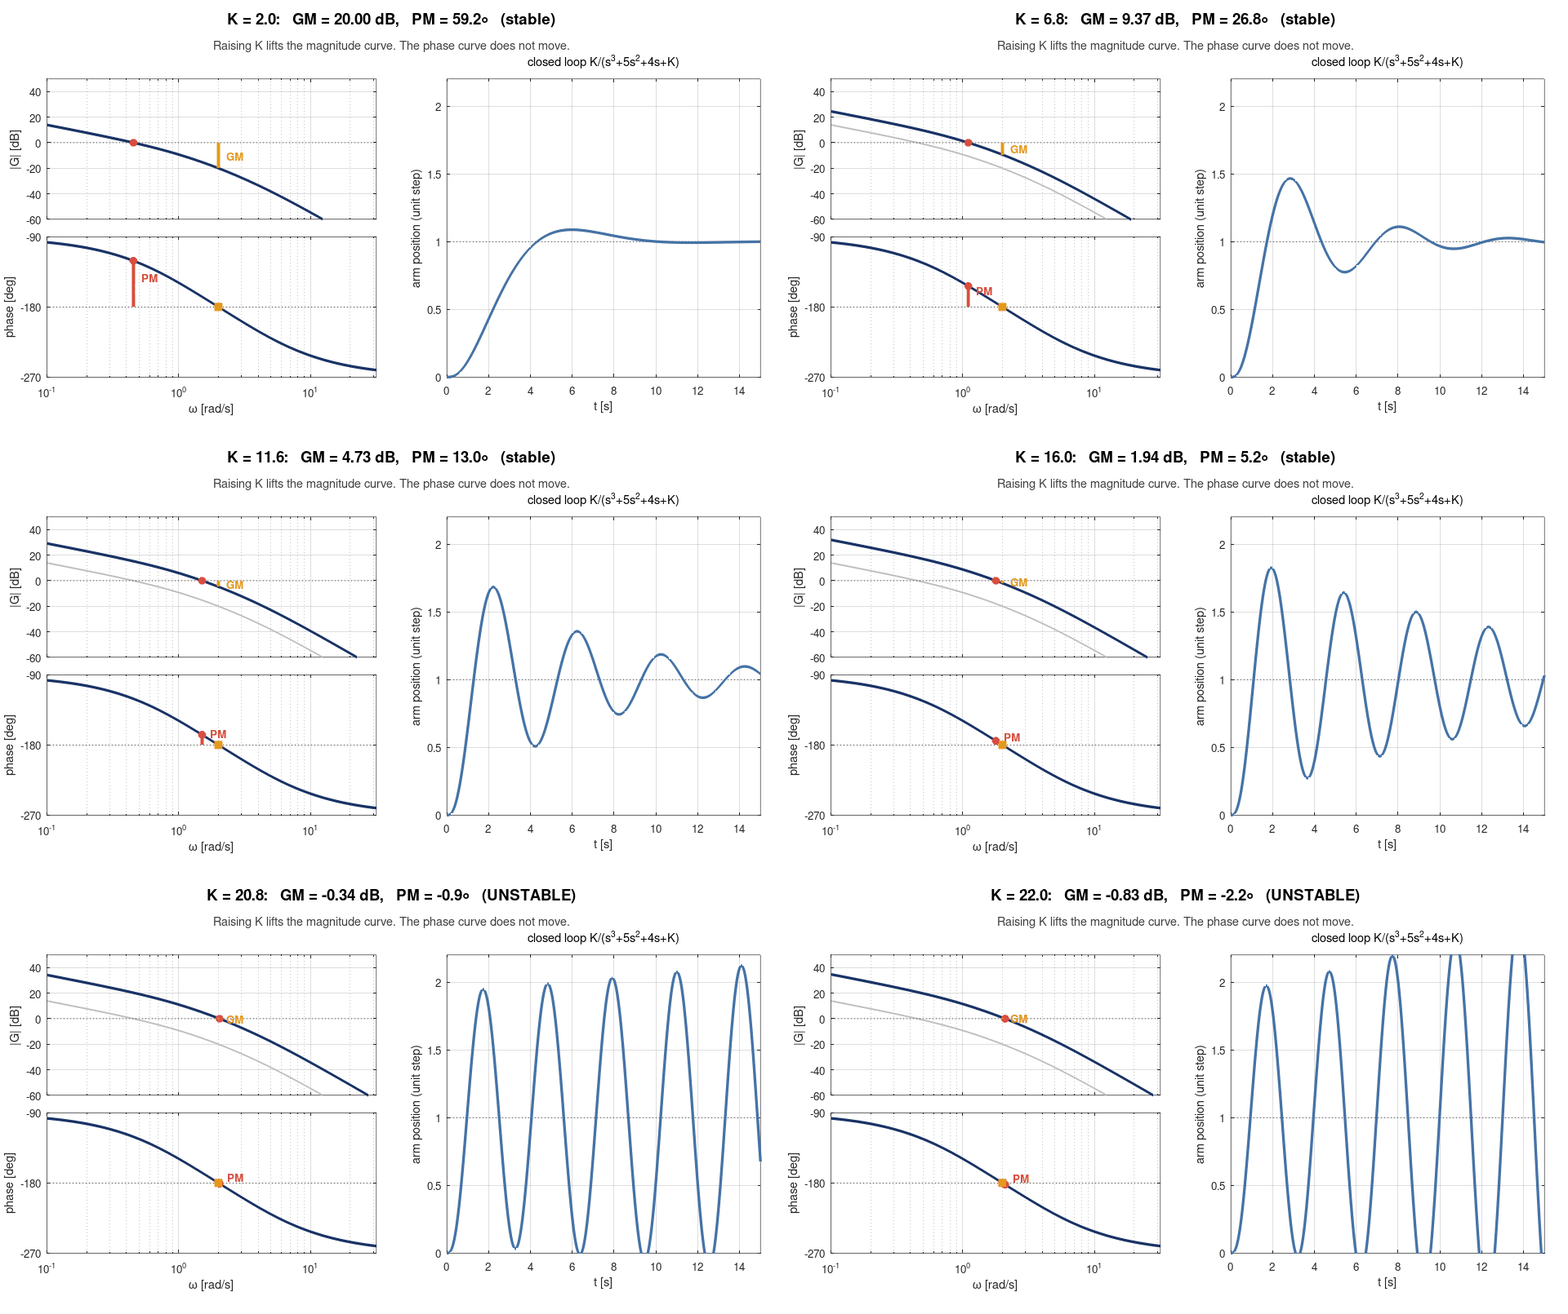
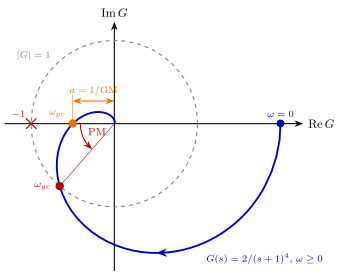
Phase margin is read at the gain crossover, gain margin at the phase crossover. The animation turns up the gain: the magnitude rises, the phase stays put, and both margins shrink.
Which formula?
Read the situation first, then pick the formula. The numbers in brackets are the handbook's equation numbers.
Gain and phase at one frequency
 (5.2)
Substitute s=jω and split into real and imaginary parts.
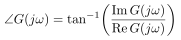 (5.3)
Mind the quadrant of the angle.
Gain in decibels
 (5.5)
Products of factors become sums of decibels.
A transfer function to sketch
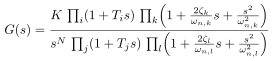 (5.6)
Time-constant form: each factor adds its own asymptote.
How close to instability
 §5.2
At the gain crossover, where |G|=0 dB.
 §5.2
At the phase crossover, where the phase is −180°.
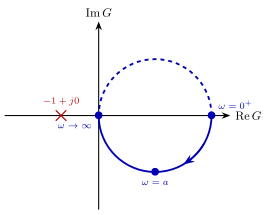
Stability from the Nyquist plot
 (5.7)
N counts clockwise encirclements of −1; P is the open-loop right-half-plane poles.
Reading the pictures
Ways to lose marks
- The wrong crossover. Phase margin at the gain crossover, gain margin at the phase crossover. Swapping them is the commonest slip.
- Both margins positive. A stable loop needs PM>0 and GM>0 dB.
- Time-constant form first. Divide each factor into the form (1+s/ω) before reading the low-frequency gain.
- Encircle −1, not the origin. Nyquist counts encirclements of the point −1.
- A log axis. Frequencies are in rad/s on a logarithmic scale: equal steps are equal ratios.
Handbook: § 5.0–§ 5.5 for the worked examples and tutorials. Slides: the Chapter 5 deck, with every animation. Download the one-page PDF to print.